f-log

just another web log

11 Dec 2019:
python filled dates fight for zero
Lets do a bit of Python(3) to get those missing dates

#Log Date Filler
#
#Reads a CSV of distributed.net stats and fills in 0 for dates that are not recorded.
import sys, csv
from datetime import datetime,timedelta

if len(sys.argv) == 1:
print("Error: filename not provided")
exit()

filename = sys.argv[1]

# accepts string date from the file and date calculated to be next in the sequence
# print 0 values until strings match
def print_missing_dates(file_str, date_obj):
while(file_str != date_obj.strftime('%d-%b-%Y')):
    print("{},0".format(date_obj.strftime('%d-%b-%Y')))
    date_obj = date_obj - timedelta(days=1)

current_date = None
with open(filename ) as csv_file:
csv_reader = csv.DictReader(csv_file)
for row in csv_reader:
    date_str = row["DATE"]
    date_obj = datetime.strptime(date_str, '%d-%b-%Y')
    if current_date is None:
     print("{0},{1}".format(csv_reader.fieldnames[0],csv_reader.fieldnames[1])) # output the column names
     print("{0},{1}".format(row["DATE"],row["UNITS"])) # output the first row of data
     current_date = date_obj
    else:
     current_date = current_date - timedelta(days=1)
     print_missing_dates(date_str, current_date)
     current_date = date_obj
     print("{0},{1}".format(row["DATE"],row["UNITS"])) # output the current matching row of data


Which breaks down to;
Get row data from CSV
if first row record it as the current_date and print the column headers and the row data
loop and get next row
minus 1 day from the current_date
while the current_date does not match the row date
print out the current_date with a 0 value
minus 1 day from the current_date
repeat
print out row data

which works perfectly so we then get this new graph
gnuplot distributed.net stats with logscale and zero values

which seems a bit "holey".

Turns out that with the logscale y in place 0 as a value is ignored and not plotted.

A quick
cat filled.csv | sed -re "s/,0/,1/" > refilled.csv
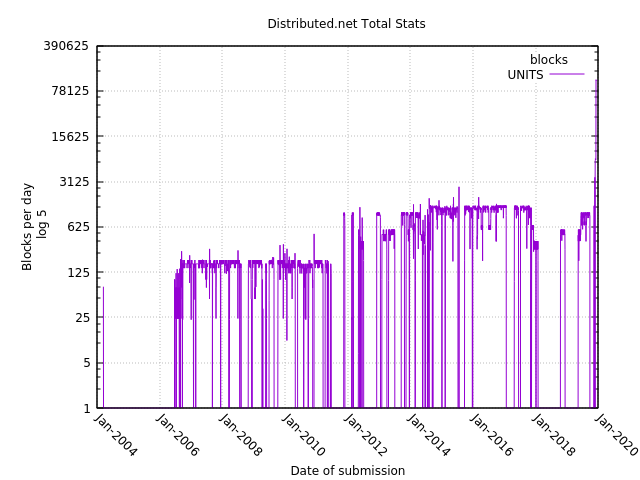
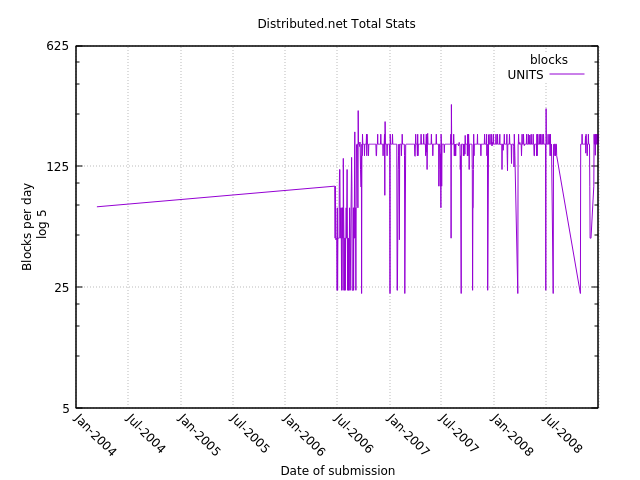
and any 0 value is now a 1 value
gnuplot distributed.net stats with logscale and zero values incremented

which is better, I think.
09 Dec 2019:
gnuplot distributed stats tidy up wave one
Lets fix the Date format first
set format x "%b-%Y" sets the output format to Month name abbreviated and the four digit year.
set xtics offset 0,0 rotate by -45 scale 0 rotates a pleasing 45°
set rmargin 6 increases the right margin to accommodate the changes.

gnuplot graph distributed.net stats to 2019-12-07 with formatted date tics

There two glaring issues left, the linear scale obscures most of the changes due to low values and there are no 0 values for dates where submissions were missed.

If only we could specify a logarithmic scale on the X axis.

set logscale y 5
set ylabel "Blocks per day\n log 5"
set grid ytics lc rgb "#bbbbbb" lw 1 lt 0
set grid xtics lc rgb "#bbbbbb" lw 1 lt 0


gnuplot graph distributed.net stats to 2019-12-07 with log 5 scale

up until this point I had either been running gnuplot -p plot.gnu with my file and editing it in vim or running the interactive gnuplot (no parameters) and copying and pasting commands in manually.
Which rather stupid, as I can just execute
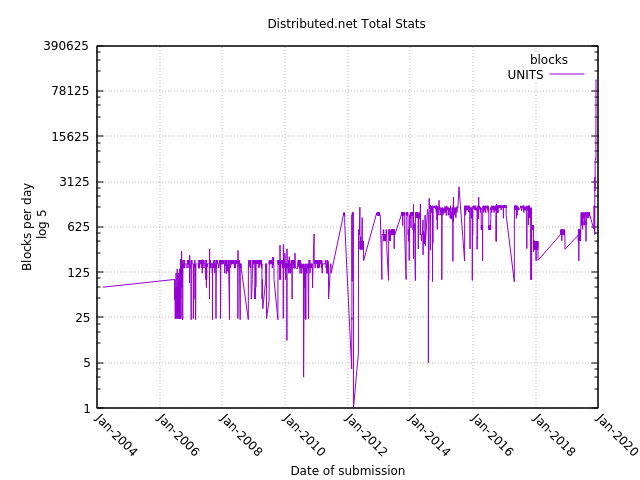
save "plot_updated.gnu"
and
load "plot_updated.gnu"
from within the interactive session!

Doh!

Another quick note:
We can zoom in on a specific date range by setting xrange e.g.
set xrange ["01-Jan-2004":"01-Jan-2009"]

gnuplot graph distributed.net stats from 2004 to 2009-01-01 with log 5 scale

This will come in handy when we try and insert all the zero day submissions.
09 Dec 2019:
distributed.net history graphed for prospeariateiy
and now I am obsessed with graphs. Wouldn't it be nice to graph my distributed.net stats?

A quick view source and there is a nice little note
IMPORTANT NOTE TO SCRIPTERS!
This page, like many stats pages, has a version which is far more suitable
for machine parsing. Please try the url:
http://stats.distributed.net/participant/phistory_raw.php?project_id=$project_id&id=$id


and if we do that we get a html page with

NOTE: Please make your scripts tolerant of additional values
in this report. Future improvements may be implemented which
result in additional fields added to each line.

---BEGIN HEADER---
ID=269589
PARTICIPANT=b_o_l_l_o_x@hotmail.com
LASTUPDATE=07-Dec-2019
---BEGIN DATA---
DATE,UNITS
07-Dec-2019,113967
06-Dec-2019,112819
05-Dec-2019,116224
04-Dec-2019,113069
03-Dec-2019,6750
02-Dec-2019,6770
01-Dec-2019,6882
......
26-Jun-2006,96
25-Jun-2006,48
24-Jun-2006,96
16-Mar-2004,73
---END DATA---


so the first job is to just strip it down to the CSV data

bit of recon

egrep -n "^---" raw.capture
14:---BEGIN HEADER---
18:---BEGIN DATA---
3314:---END DATA---


Time for a little *NIX madness. Each tool is designed to do one thing and one thing, only it does it very well AND it can pass it's output to another program of the same ilk.
cat raw.capture \
| head -n $(( $(egrep -n "^---END DATA---" raw.capture | egrep -o "^[0-9]+") -1 )) \
| tail -n +$(( $(egrep -n "^---BEGIN DATA---" raw.capture | egrep -o "^[0-9]+") +1 ))


Which happily takes all the lines up to the ---END DATA-- line(minus one for itself) and then takes all the lines from the line after ---BEGIN DATA---
Do math $(( math expr ))
Run a command $( command expr )
Get all numbers at the beginning of a line egrep -o "^[0-9]+" (and only print characters that match, rather than the whole matching line)

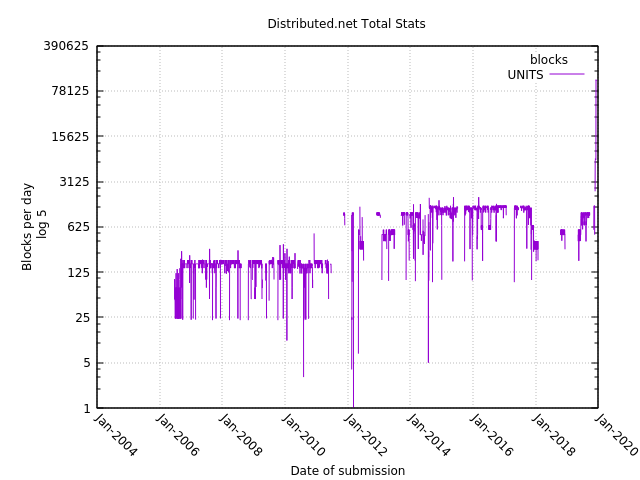
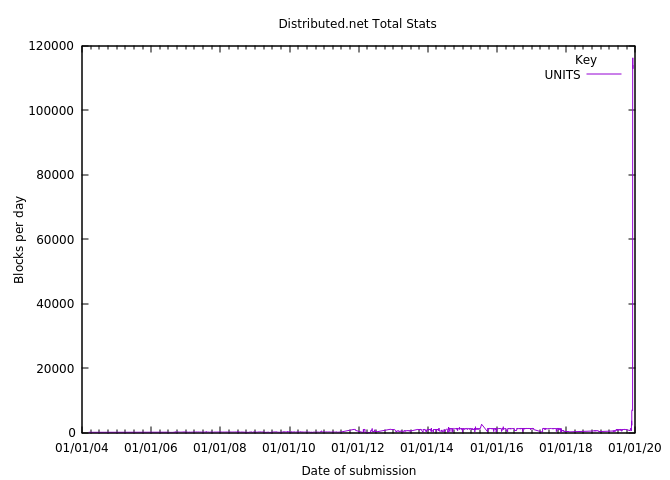
set title "Distributed.net Total Stats"
set rmargin 5
set datafile separator comma
set timefmt '%d-%b-%Y'
set xdata time
set key autotitle columnhead
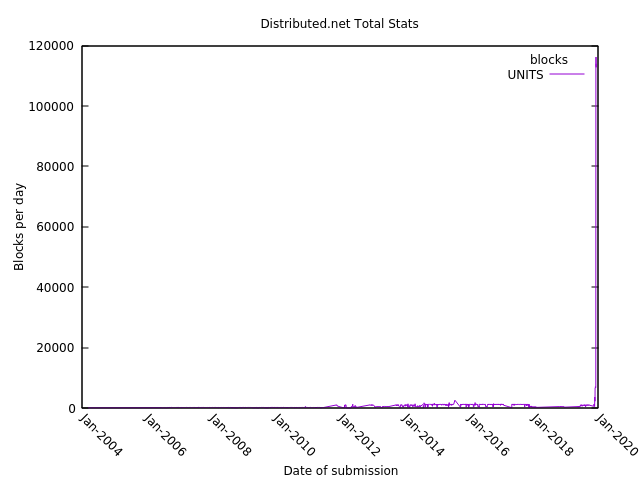
set ylabel "Blocks per day"
set xlabel "Date of submission"
plot 'raw.csv' using 1:2 with lines


set key autotitle columnhead uses the name of the column in the CSV for the Key description.
and we need to pad out the Right Margin to fit in the dates. Also we add some labels for X and Y axis.

Basic gnuplot graph of my distributed.net stats to 2019-12-07

Next time I will investigate making it a little more readable.
08 Dec 2019:
the pavilion of pavillion
Not sure why I spelt Pavilion wrong every time there :s
08 Dec 2019:
plotting how to best plot a gnuplot plot
The last time I used GNUPlot was back in 2013 for a short lived project to plot room temperature with a Raspberry Pi. I remember it being a baptism of fire.

So we need the commands and settings to create the specific type of graph.

Word of warning! I tried numerous times to use the interactive gnuplot program and could not understand why the output was 0 bytes but the thumbnail looked like my expected graph. Turns out that you have to exit gnuplot for it to save the file. So from then on, instead of writing to a file I used the terminal type qt, which is one of the interactive types. This allows you to see the results and export them when you are happy, rather than creating a PNG/PDF etc file every time.

I went through a lot of versions and this was the first one that had the time right. It also showed how to override the default colours.

graph of my computer rendering times windows and linux CPU vs GPU vertical orientation

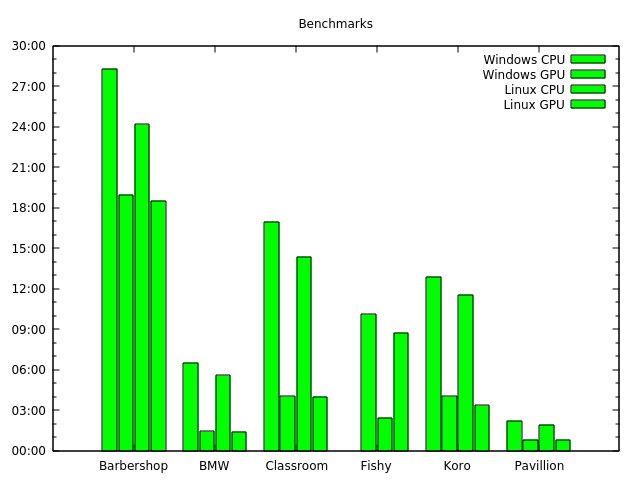
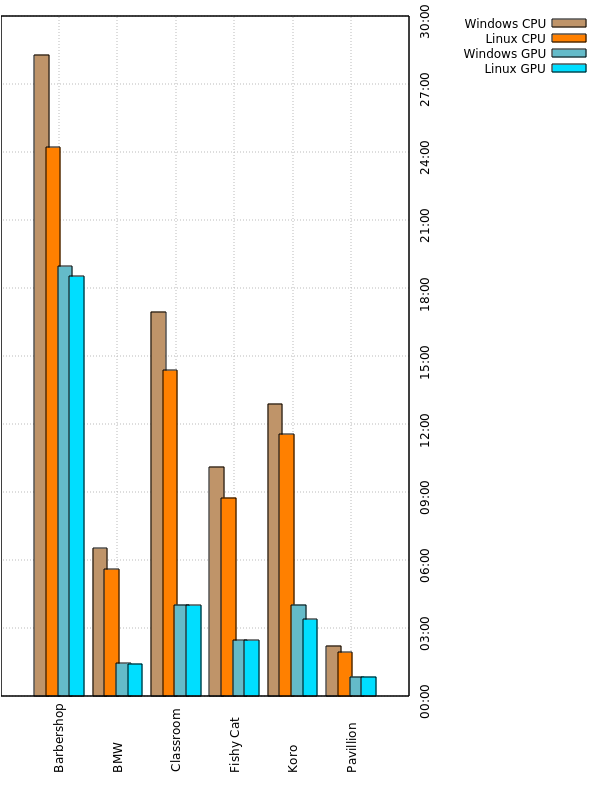
set title "Benchmarks"
set timefmt "%M:%S"
set ydata time
set yrange ["00:00":"30:00"]
set style data histogram
set style histogram cluster gap 1
set style fill solid border -1
set boxwidth 0.9
plot 'data.dat' using 2:xtic(1) ti col linecolor rgb "#00FF00", '' u 3 ti col linecolor rgb "#00FF00", '' u 4 ti col linecolor rgb "#00FF00", '' u 5 ti col linecolor rgb "#00FF00"


The title is obvious and in later revisions excluded.
set timefmt sets the time format to Minutes and Seconds. Lots of examples online of percentage, dates or seconds, so I had to just guess. Really expected it to work it out automagically.
set ydata tells the plot to use time on the Y axis
set yrange sets the Y axis range, otherwise it tries to guess what the min/max should be.
set data histogram sets the 2D plotting format to Histogram, needed for the next command.
set histogram cluster creates the clustering of the different data columns, otherwise they would just be sequential.
Then set the style and finally the plot command, that does all the work. plot.dat is our input file and then I copied pasted the rest from examples :)

OK, so that is the proof of concept out of the way. Now I want the OSs to be next to each other...

So how do we get from
scene    "Windows CPU"    "Windows GPU"    "Linux CPU"    "Linux GPU"
Barbershop    28:16    18:56    24:11    18:30
BMW    6:30    1:25    5:34    1:24
Classroom    16:56    4:01    14:21    3:59
"Fishy Cat"    10:05    2:26    8:43    2:26
Koro    12:53    4:01    11:32    3:22
Pavillion    2:11    0:49    1:55    0:49

to
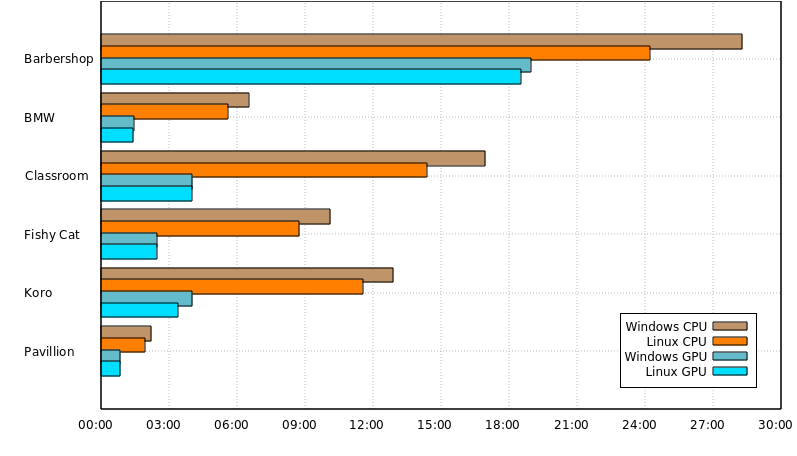
scene    "Windows CPU"    "Linux CPU"    "Windows GPU"    "Linux GPU"
Barbershop    28:16    24:11    18:56    18:30
BMW    6:30    5:34    1:25    1:24
Classroom    16:56    14:21    4:01    3:59
"Fishy Cat"    10:05    8:43    2:26    2:26
Koro    12:53    11:32    4:01    3:22
Pavillion    2:11    1:55    0:49    0:49


We need to scoot the columns around from data.dat so the CPUs and GPUs are together into data_cluster_type.dat.
paste <(cut -f1 data.dat) <(cut -f2 data.dat) <(cut -f4 data.dat) <(cut -f3 data.dat) <(cut -f5 data.dat) > data_cluster_type.dat


Which basically just pastes each column one at a time with columns 3 and 4 swapped around.

Next we have
graph of my computer rendering times windows and linux CPU vs GPU vertical orientation in colour

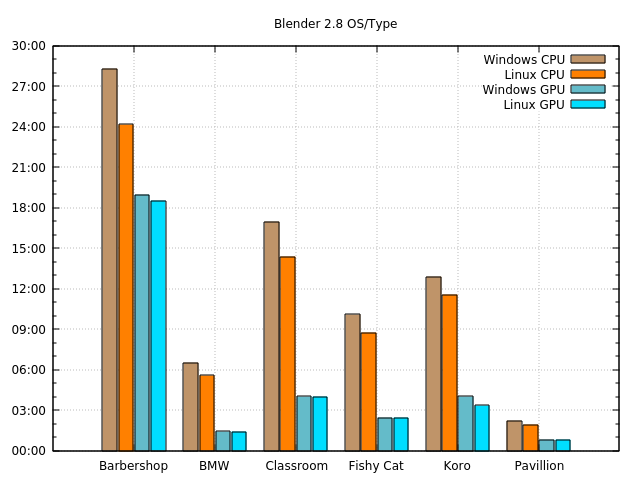
set title "Blender 2.8 OS/Type"
set timefmt "%M:%S"
set ydata time
set yrange ["00:00":"30:00"]
set style data histogram
set style histogram cluster gap 1
set style fill solid border -1
set boxwidth 0.9
set grid ytics lc rgb "#bbbbbb" lw 1 lt 0
set grid xtics lc rgb "#bbbbbb" lw 1 lt 0
plot 'data_cluster_type.dat' using 2:xtic(1) ti col linecolor rgb "#BF9469", '' u 3 ti col linecolor rgb "#FF8000", '' u 4 ti col linecolor rgb "#64BBC9", '' u 5 ti col linecolor rgb "#00DEFF"


Which is the same as last time except we have altered the title, added grid lines and changed the colours. All with the new data file.

Now to get the rotation, overlapping columns etc we use

set term qt size 600, 800
set key outside
set lmargin 0
set bmargin 7
unset title
set xtics offset 0,-4.6 rotate by 90 scale 0
unset ytics
set y2tic offset 0,-1.5 rotate by 90 scale 0
set timefmt "%M:%S"
set ydata time
set yrange ["00:00":"30:00"]
set y2data time
set y2range ["00:00":"30:00"]
set style data histogram
set style histogram cluster gap 1
set style fill solid border -1
set boxwidth 1.25
set grid y2tics lc rgb "#bbbbbb" lw 1 lt 0
set grid xtics lc rgb "#bbbbbb" lw 1 lt 0
plot 'data_cluster_type.dat' using 2:xtic(1) ti col linecolor rgb "#BF9469", '' u 3 ti col linecolor rgb "#FF8000", '' u 4 ti col linecolor rgb "#64BBC9", '' u 5 ti col linecolor rgb "#00DEFF"


A lot has changed and been added so lets go through the new and altered lines.

set term qt size Do not need the title anymore, but we do need to set the overall size. The only way to do this is specify the terminal. Luckily when starting gnuplot it reports it's terminal as qt. The size is important to make room for the rotated labels.
set key outside Although you can control the appearance of most things, key/legend cannot be rotated 90°. This puts the information outside the main graph for easy manipulation later.
set bmargin Changes the Bottom Margin so there is space for the rotated labels on the X axis.
unset title Remove the title, otherwise we have to mess about rotating that as well.
set xtics offset 0,-4.6 rotate by 90 scale 0 Offset the X labels(tics) and rotate them by 90°.
unset ytics Remove the default configuration information for the Y labels. If you do not do this it mucks up the grid lines later.
set y2tic offset 0,-1.5 rotate by 90 scale 0 Offset the Y labels(tics) and rotate them by 90°. The 2 in y2tic refers to the labels being on the right instead of the left.
Then notice later in the commands we set the y2data and y2range and then use y2tics for the grid source.
Finally we set the boxwidth to create the slight overlap for the columns. I was actually trying to get rid of the margins inside the graph, but that went nowhere.

But this results in

graph of my computer rendering times windows and linux CPU vs GPU raw gnuplot output

So a few minutes in GIMP and we are left with

graph of my computer rendering times windows and linux CPU vs GPU

This was not a quick or easy journey.
history | egrep gnuplot | wc -l
107

Though admittedly a couple of those executions were just to test things for this blog post and to create the intermediary images.
08 Dec 2019:
linux beats windows in cpu vs gpu showdown graph
The main thing I wanted to do with my brand new machine was compare Windows Blender rendering and Linux Blender rendering. Then to show CPU vs GPU.

The machine came with Windows 10(since expunged) so I installed Blender 2.8 and downloaded the Blender benchmark tool. Only top find that it does not use 2.8 and fails on GPU rendering.

But all was not lost, because it downloaded all the demo scenes.

So I manually ran each one in Windows with both CPU and GPU and noted the results. Then once I got NVIDIA CUDA working on Linux I did the same.

Blender 2.8 - Windows/Linux CPU vs GPU
graph of my computer rendering times windows and linux CPU vs GPU
Time MM:SS - lower values are better

Raw data
SceneWindows CPULinux CPUWindows GPULinux GPU
Barbershop28:1624:1118:5618:30
BMW6:305:341:251:24
Classroom16:5614:214:013:59
Fishy Cat10:058:432:262:26
Koro12:5311:324:013:22
Pavillion2:111:550:490:49


A couple of quick notes: The Classroom demo file in the Benchmark is out of date and all the desks and instances do not render(fix demo files). The Pavillion has preset Scenes for CPU and GPU so I used them.

As it was quite an exercise to get GNUPlot to create that graph, so I will devote another blog post to the nitty gritty
06 Dec 2019:
distributed net wallops gpu after impressive run
Way back on the 16th of March 2004 I submitted my first day's blocks to distributed.net. The total for that day was 79.

It looks like I averaged about 150 blocks a day for 10 years. Then it shot up to an average of 1200 blocks per day. This corresponded with getting a new computer. A 700% increase from 150 blocks per day average.

Speaking of new computers, my new i5 running the standard dnetc client pushed this up to 6800 blocks per day average. Very respectable 424% increase from 1200 blocks per day average.

Now what if instead of running dnetc on the CPU I tried the GPU?

After some mucking about getting Blender working the NVidia CUDA all I need to do was specify the library path.
export LD_LIBRARY_PATH=/opt/dnet-cuda/dnetc520-linux-amd64-cuda70/lib/ ; ./dnetc

And now I am getting 114,000 blocks per day average! A 1576% increase from 6800 blocks per day average.

That is a massive 75,900% increase from 150 blocks per day average in just 15 years :D

I have now been running the client on these various machines for 5,743 days.

Never surrender! (even though RCA quit offering the prize for cracking it)
05 Dec 2019:
meld smears xinputrc all over
One of my all time favourite opensource apps is "meld". A graphical diff program for comparing files.

Just tried it and got a horrible smear of results, totally unreadable. What is interesting is the fix is to change the file ~/.xinputrc
from
run_im xim
to
run_im none

which is weird, but after a reboot works!

https://gitlab.gnome.org/GNOME/meld/issues/186
05 Dec 2019:
virtualbox reveals timing secret and sound works again
Initial VirtualBox settings are Alsa AC97.

Shutdown and changed to OSS AC97. Same results, no sound, aplay hangs
Current FLAG settings on host includes alsa but does not include pulseaudio.
user running VirtualBox is in the vboxusers group

Well I am really glad I did not install pulseaudio because this all a known issue and has been for almost a year.

The fix is force the timing back to an older value via
VBoxManage setextradata global VBoxInternal2/Audio/ALSAAudio/BufferSizeMs "100"
(run while VM is shutdown)

There is a lot of discussion and not a lot of fixing or empowering the users.
https://forums.gentoo.org/viewtopic-t-1104042-highlight-virtualbox.html
https://forums.virtualbox.org/viewtopic.php?f=7&t=95560
https://forums.virtualbox.org/viewtopic.php?f=7&t=93940
https://www.virtualbox.org/ticket/18342
https://www.virtualbox.org/ticket/18820

So now I have my old Lubuntu VM working also!

too many VMs, should I try the others on the list?
05 Dec 2019:
linux lite the fight for sound continues
Lets start with Linux Lite

Current Release Name: Linux Lite 4.6
Architecture: 64bit
Software Base: Ubuntu 18.04.3 LTS
Desktop Environment: XFCE 4.12.3

Nice. Ubuntu based and XFCE, my favourite.
Not so nice, 1.4G download, so lots of stuff to uninstall, or is it just locally available?

I am giving each VM 4 of my hosts 16G of RAM and 25G Disk and three processors and 128MB GFX RAM

First impressions:
Boots off Live DVD ISO and offers straight away to install, which is good.
Quick, clear install wizard, allows me to set UK keyboard. Quick to select all the options.
Clear information during install and extra verbose information easily accessible.
Very quick first boot and the clear beginner options, install updates, documentation etc.
VirtualBox drivers seem to be installed as mouse, screen resizing and bi-directional clipboard work without changing anything.
Surprisingly sluggish responding to clicks, maybe it is updating in the background.
No sound, aplay hangs! VirtualBox was set to the default sound device AC97.
YouTube stutters and has no sound.

Remember, this Gentoo host is brand new and its own sound works fine.

05 Dec 2019:
linux distros fight for the right to be imortalised
Now the search begins for a new Linux distro to base my VM on.

Found the following list
Lubuntu | The official Lubuntu home
Linux Lite Easy to Use Free Linux Operating System
Crunchbangplusplus | Debian Based Minimal Linux Distro
antiX Linux "antiX Magic" in an environment suitable for old and new computers
Home | SparkyLinux
Puppy Linux Wiki: PuppyLinux
Tiny Core Linux, Micro Core Linux, 12MB Linux GUI Desktop, Live, Frugal, Extendable
Damn Small Linux, Download the ISO
Home - Porteus - Portable Linux
Welcome to VectorLinux VectorLinux.com
BunsenLabs Linux :: Installation

Last time one of my main requirements was a pre-built VM. Thinking being it would be setup to work 100% as a VM. This time I will install manually.

The beauty of VMs is I can try them all! But, I really do not have time for that.

Lets start with when they were last updated.

These might have unseen updates, but as I have to cull something ...
Damn Small Linux has not been updated since 2012, so that's out.
Porteus - no updates since April 2018
VectorLinux - no updates since April 2015

All these have updates in the last 12 months, most in the last 30 days
Crunchbangplusplus
Tiny Core Linux
BunsenLabs Linux
Puppy Linux
SparkyLinux
antiX Linux
Linux Lite
Lubuntu

You will notice that most, if not all, are targeted at running on old machines, low spec machines or just to be a small foot print. I believe this will be the best strategy to a responsive VM, although maybe I should be a bit more generous with my system resources now that I have them.
05 Dec 2019:
hard work down the alsa mines
Just to make it clear I did try and resolve my VM sound issues, here are selection of commands I found in the history.

FYI some are nonsense or not applicable. There were many many repeats and variations that I did not include, not to mention all the ls,cat,file,vi etc used to check and mess things about.
Also they are not in true date order. I had used multiple terminals.


cp /usr/share/sounds/alsa/Side_Right.wav ~/test.wav
sudo alsa force-reload
sudo apt-get install alsa-base pulseaudio
alsamixer
free -g
sudo alsa force-reload
killall pulseaudio; rm -r ~/.config/pulse/* ; rm -r ~/.pulse*
pulseaudio -k
aplay -L
aplay /usr/share/sounds/alsa/Side_Right.wav
aplay -v /usr/share/sounds/alsa/Side_Right.wav
wget -O alsa-info.sh http://www.alsa-project.org/alsa-info.sh && chmod +x ./alsa-info.sh && ./alsa-info.sh
pavucontrol
aplay -D plughw:0,3 /usr/share/sounds/alsa/Front_Center.wav
pulseaudio --start
sudo killall pulseaudio; sudo alsa force-reload;
alsactl init
sudo alsa force-unload
sudo alsa force-reload
cat /proc/asound/cards
groups
pactl list short sinks
pulseaudio --check
ls .config/pulse/ -al
pasuspender -- speaker-test -c 2 -t wav
pasuspender -- speaker-test -c 2 -t wav -D plughw:CARD=Intel,DEV=0
aplay -D plughw0,0 /usr/share/sounds/alsa/Side_Right.wav
aplay -D plug:dmix /usr/share/sounds/alsa/Side_Right.wav
pulseaudio --version
pactl info
pulseaudio --system -vvvvv &
pactl list cards
pactl list sinks
speaker-test -c 2 -t wav
ps
killall speaker-test
cat /proc/asound/cards
sudo apt-get remove --purge alsa-base pulseaudio
sudo apt-get install alsa-base pulseaudio pavucontrol
sudo apt-get install --reinstall dkms alsa-base pulseaudio pavucontrol
sudo vi /etc/modprobe.d/alsa-base.conf
tail syslog
sudo gpasswd -a osboxes audio
while (true); do pulseaudio -k;done
cat /usr/share/sounds/alsa/Side_Right.wav | aplay
strace aplay /usr/share/sounds/alsa/Side_Right.wav
alsabat
alsabat --local test.wav
mkdir src
cd src;git clone https://github.com/alsa-project/alsa-utils.git
sudo apt install git
git clone https://github.com/alsa-project/alsa-utils.git
cd alsa-utils/
sudo apt install automake
sudo apt install ncurses
sudo apt install ncurses-lib
sudo apt install gettext
gettextize
aclocal -I m4
cat INSTALL
autoheader
automake --foreign --copy --add-missing
autoconf
./configure
sudo apt install alsa-lib
aplay -Dfront:CARD=Intel,DEV=0 test.wav
aplay -Dhw:CARD=Intel,DEV=0 ~/test.wav
aplay -Dhw:CARD=Intel,DEV=1 ~/test.wav
aplay -Dplughw:CARD=Intel,DEV=1 ~/test.wav
aplay -Dplughw:CARD=Intel,DEV=0 ~/test.wav
aplay -Dsysdefault:CARD=Intel ~/test.wav
sudo apt install libasound2-dev
cd aplay/
cat Makefile.am
make aplay
alsabat -Pplughw:0,0
alsabat -Pplughw:0,1
cat /proc/asound/version
grep VERSION_STR /usr/include/alsa/version.h
lspci | egrep -i audio
ls -l /proc/asound/cards
cat /proc/asound/cards
ls /dev/snd/
file /usr/share/alsa/alsa.conf
lsmod | egrep snd
dmesg | egrep snd
dmesg | egrep -i sound
dmesg | egrep -i alsa
less /var/log/kern.log
less /var/log/syslog
aplay -Dsysdefault:CARD=Intel ~/test.wav
cat /etc/modprobe.d/alsa-base.conf
sudo vi /etc/modprobe.d/alsa-base.conf
aplay -Dsysdefault:CARD=Intel ~/test.wav
aplay -Dplughw:CARD=Intel,DEV=0 ~/test.wav
aplay -Dplughw:CARD=Intel,DEV=1 ~/test.wav
speaker-test -Dhw:0,3 -c2 #Or -Dhw:0,7
speaker-test -Dhw:0,0 -c2 #Or -Dhw:0,7
speaker-test -Dhw:0,1 -c2 #Or -Dhw:0,7
speaker-test -Dhw:0,2 -c2 #Or -Dhw:0,7
sudo apt install mplayer mpg321
mplayer ~/test.mp3
sudo mplayer ~/test.mp3
mplayer -ao alsa:device=hw=0.0 ~/test.mp3
aplay -l
mplayer -ao alsa:device=hw=0.1 ~/test.mp3
mplayer -ao pulse ~/test.mp3
mplayer -ao alsa:device=hw=0 ~/test.mp3
pulseaudio -D
pulseaudio -Dvvvv
pulseaudio -vvvv
vi ~/.asoundrc
aclocal --verbose &gt;v.txt 2&gt;&1
egrep -ni po.make configure.ac
vi configure.ac
uname -a
make
gcc -DHAVE_CONFIG_H -I. -I../include -I../include -g -O2 -c -o aplay.o aplay.c
gcc -g -O2 -o aplay aplay.o -lrt -lasound -lm -ldl -lpthread
./aplay ~/test.wav
./aplay ~/test.wav
file ~/test.
./aplay /usr/share/sounds/alsa/Front_Center.wav
./aplay /usr/share/sounds/alsa/Front_Left.wav
./aplay /usr/share/sounds/alsa/Front_Right.wav
./aplay /usr/share/sounds/alsa/Noise.wav
./aplay /usr/share/sounds/alsa/Rear_Center.wav
./aplay /usr/share/sounds/alsa/Rear_Left.wav
./aplay /usr/share/sounds/alsa/Rear_Right.wav
./aplay /usr/share/sounds/alsa/Side_Left.wav
./aplay /usr/share/sounds/login.wav
./aplay /usr/share/sounds/info.wav
time ./aplay /usr/share/sounds/info.wav
time ./aplay /usr/share/sounds/login.wav
cat /dev/random &gt; /dev/dsp
sudo cat /dev/random &gt; /dev/dsp
dmesg -T
ls -hartl /var/log/
sox ~/test.mp3 -t ossdsp /dev/dsp
cat '/proc/asound/card0/codec#0'
cat '/proc/asound/cards/card0/codec#0'
cat '/proc/asound/card1/codec#0'
ln -s '/proc/asound/card1' '/proc/asound/card0'
ln -s '/proc/asound/card0' '/proc/asound/card1'
ln -s '/proc/asound/card1' '/proc/asound/card0'
pacmd
cat /etc/pulse/daemon.conf
sudo vi /etc/pulse/daemon.conf
ps | grep pa
ps | grep pul
cat /etc/modprobe.d/osspd.conf
cat /etc/modprobe.d/blacklist-oss.conf
cat /etc/modprobe.d/alsa-base.conf
ls -Rla /proc/asound/cards
pactl list
sudo service pulseaudio stop
pasuspender -- cadence
sudo vi /etc/pulse/client.conf
pulseaudio -vvv
pulseaudio -vD
sudo apt-get remove --purge alsa-base
sudo apt-get remove --purge pulseaudio
sudo apt-get install alsa-base
sudo apt-get install pulseaudio
sudo alsa force-reload
aplay -L | grep --context=1 ^default
pavucontrol&
speaker-test --channels=2 --nloops=1 --test=wav --device=default
fuser /dev/snd/*
mplayer -ao alsa:device=hw=0 ~/test.mp3
paplay /usr/share/sounds/generic.wav
pulseaudio --daemonize=no --log-target=stderr --log-level=4
pactl list sinks | grep -e device.description -e device.string
pasuspender -- speaker-test --nloops=1 --channels=2 --test=wav --device=$device_string
pasuspender -- speaker-test --nloops=1 --channels=2 --test=wav --device="iec958:0"
rm -r ~/.pulse
rm -r ~/.pulse-cookie
rm -r ~/.config/pulse
rm ~/.asoundrc
pactl list short sources
pactl list short sinks
less ~/.xsession-errors
vi ~/.asoundrc
pulseaudio --daemonize=no --log-target=stderr --log-level=4
aplay -D hw:0,0 test.wav
speaker-test --channels=2 --nloops=1 --test=wav --device=default
speaker-test -c2 -D hw:1,0 -l1 -twav
speaker-test -c2 -D hw:0,0 -l1 -twav
speaker-test -c2 -D hw:0,1 -l1 -twav
alsamixer -c1
alsamixer -c2
alsamixer -c0
sudo usermod -a -G hwaudio osboxes
cat /proc/asound/cards
aplay -D hw:0,0 test.wav
alsa restart
alsa reload
sudo alsa reload
sudo aplay -D hw:0,0 test.wav
aplay -c 1 -r 192000 test.wav
aplay --dump-hw-params
aplay -D hw:0 --dump-hw-params
sudo aplay -D hw:0 --dump-hw-params
sudo aplay --dump-hw-params
aplay -c 2 -r 192000 test.wav
sudo aplay -c 2 -r 192000 test.wav

05 Dec 2019:
2016 called they want it a bit quietier
So just before I burn the VM with no sound I quickly restored the earliest snapshot, 2016. No sound and same hanging aplay :(

Even tried updating and then installing pulseaudio. No sound and same hanging aplay :(

Checked all the usual suspects, no errors, no weird configuration.

But I did have sound working on the VM in the past, honest! Admittedly it kept having issues with pulseaudio crashing and needing restarting, but it DID work.
03 Dec 2019:
pulse alsa finally beats me to a bloddy pulp
Another 8 hours pass and I have uninstalled and reinstalled pulseaudio and alsa so many times.
I have edited so many system wide and local config files.

and I have nothing to show for it.

There are still NO ERRORs anywhere reported on the system. aplay and most other console based audio just hangs.

Every possible test(and I have found a lot of them) all pass, the hardware is detected and setup and has NO ERRORs.

So I have to give up and say goodbye to this VM.

Gives me a change to try something new :)
loading results, please wait loading animateloading animateloading animate
[More tags]
rss feed

email

root

flog archives


Disclaimer: This page is by me for me, if you are not me then please be aware of the following
I am not responsible for anything that works or does not work including files and pages made available at www.jumpstation.co.uk I am also not responsible for any information(or what you or others do with it) available at www.jumpstation.co.uk In fact I'm not responsible for anything ever, so there!